
Here’s the hard truth: most SaaS companies are flying blind. Revenue ticks up, headcount grows — but nobody really knows why users churn, which ads actually convert, or where the growth is really coming from.
Your data lives in three different places. Stripe handles billing. Your CRM owns the leads. Your product database tracks usage. None of them talk to each other.
That’s the data blind spot — and it’s the #1 reason best SaaS analytics tools matter in 2026. Without unified analytics, you can’t scale. Period.
The Core Problem: No unified analytics = no scalable growth. You can’t optimize what you can’t measure. And you can’t measure what’s scattered across five tools.
2. The 5 SaaS Metrics You Must Track
Before you pick any tool, you need to know what you’re measuring. These five metrics form the foundation of every healthy SaaS business. Skip even one, and you’ll miss a critical warning sign.
MRR / ARR — Your growth engine. Track it daily.
Churn Rate — The silent revenue killer. Watch it weekly.
LTV : CAC — Healthy SaaS = 3:1 ratio or better.
ARPU / ARPA — Guides your pricing strategy decisions.
ROAS — Proves your ads are actually making money.
MRR and ARR are your north-star metrics. They tell you if growth is accelerating or stalling. Churn rate is where most teams get blindsided — high churn quietly kills expansion revenue before you notice. The LTV:CAC ratio tells you if your business model is actually viable. A healthy SaaS business typically achieves an LTV:CAC ratio of 3:1 or more. Track ARPU/ARPA to optimize pricing. And always measure marketing ROAS — if your ads aren’t provably profitable, they’re burning cash.
3. Ask Yourself These 3 Questions First
The best tool for your competitor isn’t the best tool for you. Before you sign up for anything, answer these three questions honestly.
Q1: Do you need revenue analytics or marketing attribution?
Revenue analytics tools (like Baremetrics) track subscription health. Marketing attribution tools track where customers come from. Many companies need both — but not always from the same platform. Start with the pain you feel most.
Q2: Do you need embedded analytics for your users?
Some SaaS products need to show data dashboards inside the product itself. If your customers need their own analytics view, you need a white-label embedded analytics platform — not just an internal tool.
Q3: Is your data fragmented across multiple tools?
If your revenue data lives in Stripe, Paddle, and a custom database, you need a Zero-ETL data integration for SaaS first. No analytics tool works well on messy, siloed data.
Pro Tip: Don’t buy a tool to solve a symptom. First, diagnose the root cause. Is your problem visibility, attribution, or data fragmentation? The answer changes everything.
4. Best SaaS Analytics Tools (By Use Case)
We’ve broken down the top SaaS revenue tracking software and analytics platforms into four categories. Each one solves a different problem. Match your need to the right tool — don’t overspend on features you’ll never use.
Revenue Analytics — Track MRR, Churn & Subscription Health
Best for: Stripe and Paddle-based SaaS products that need instant revenue visibility.
Baremetrics
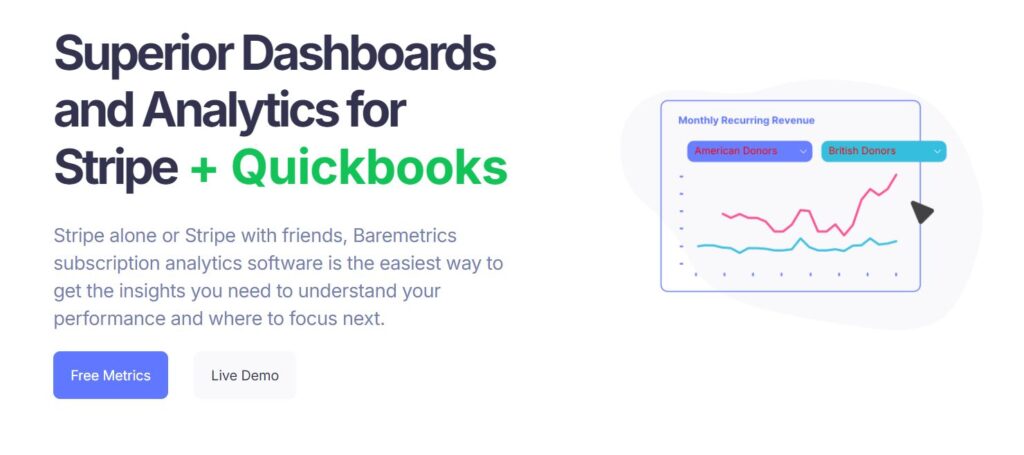
The gold standard for SaaS revenue analytics. Connect Stripe in minutes and instantly see your MRR and ARR dashboard alongside churn, LTV, and ARPU. The built-in dunning management recovers failed payments automatically — that’s passive MRR recovery on autopilot.
[Plug-and-play] [Dunning / Recovery] [Best for founders]
ChartMogul
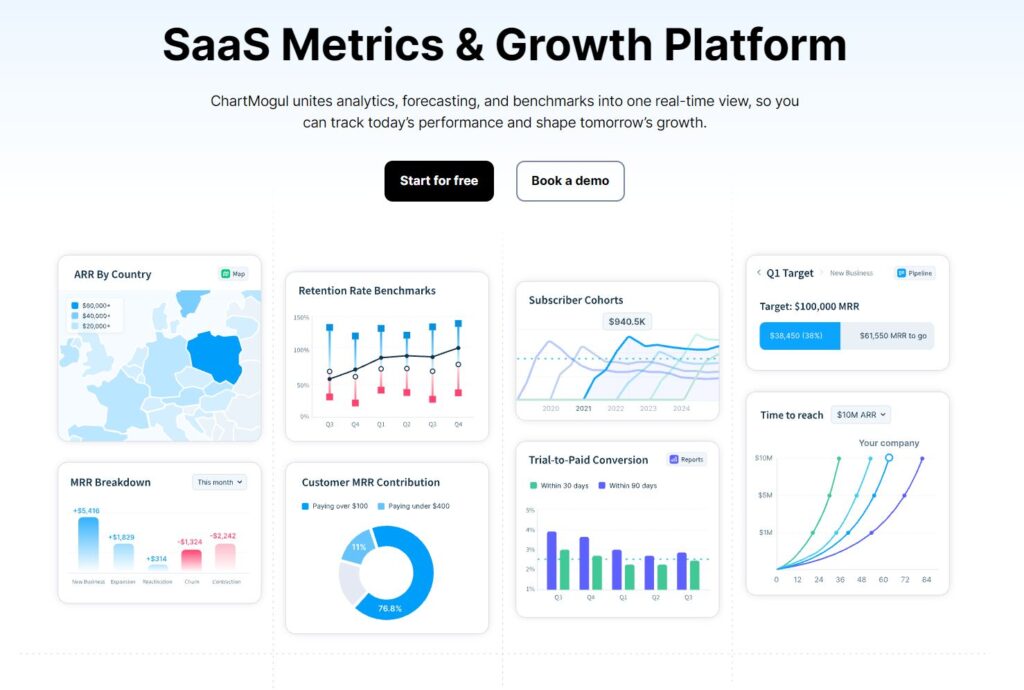
A powerful choice for teams that need deep financial reporting and forecasting. ChartMogul handles complex revenue recognition and multi-source billing data with precision. Ideal for growth-stage teams with finance requirements.
[Advanced forecasting] [Finance-grade reporting]
Chartsy
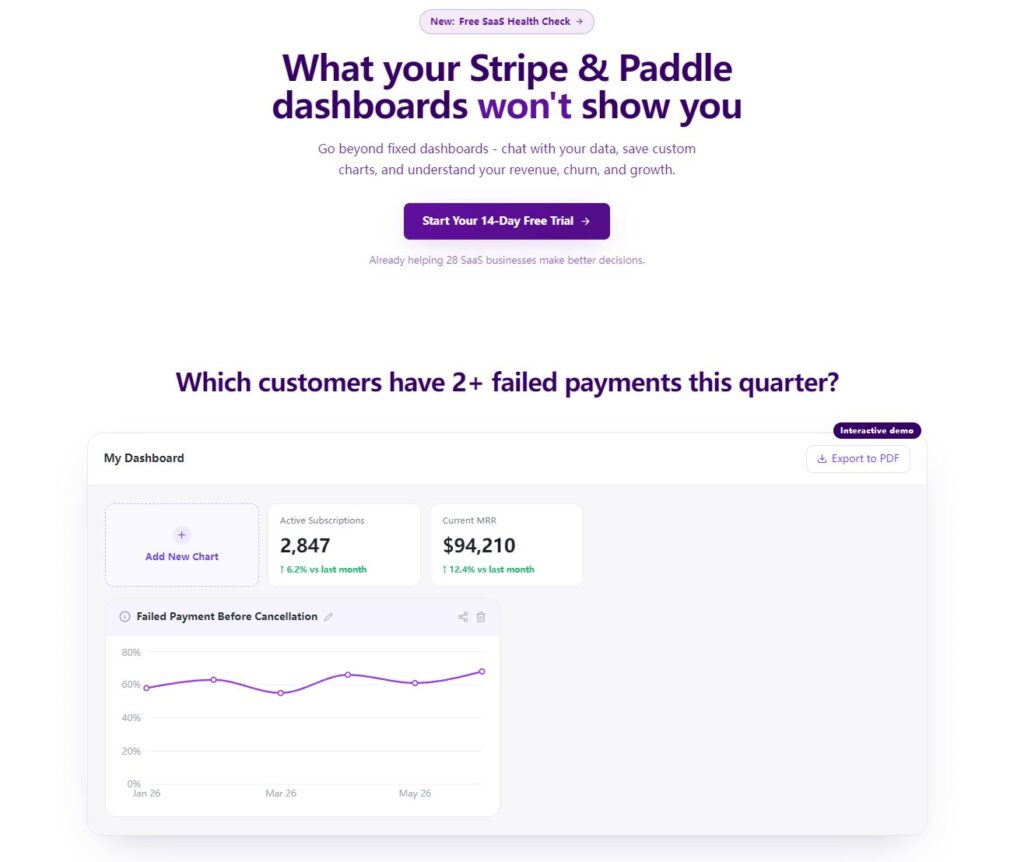
A lean, fast option built specifically for Stripe and Paddle reporting tools. If you want clean, beautiful dashboards without a steep learning curve, Chartsy delivers. Great entry point for early-stage teams.
[Stripe/Paddle native] [Low cost]
Marketing Attribution — Know Exactly Which Ads Drive Revenue
Best for: SaaS teams spending $1,000+/month on paid acquisition and needing real attribution data.
Cometly
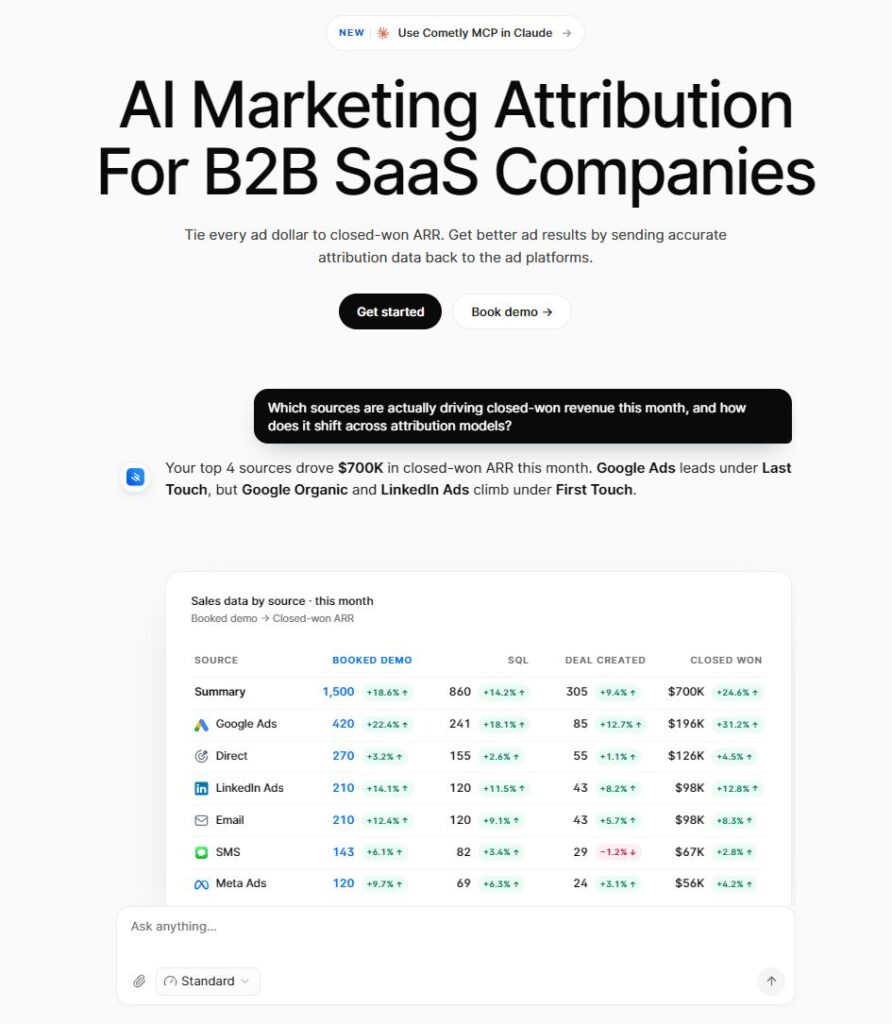
The best SaaS marketing attribution software for paid teams. Cometly tracks the full funnel — from ad click to free trial to paid subscription — giving you honest ROAS data across every channel. If you’re running Facebook or Google ads for SaaS, this is non-negotiable.
[Full-funnel tracking] [Multi-channel] [Best for paid growth]
Google Analytics 4 (GA4)
Free and powerful — but complex to configure for SaaS attribution. GA4 works best as a complementary layer. It’s excellent for top-of-funnel analysis but struggles with subscription-specific events. Pair it with a dedicated attribution tool for full visibility.
[Free tier available] [Needs configuration]
Embedded Analytics — Give Your Users Their Own Data Dashboard
Best for: SaaS products that want to deliver analytics as a feature — and turn data into a competitive moat.
Qrvey
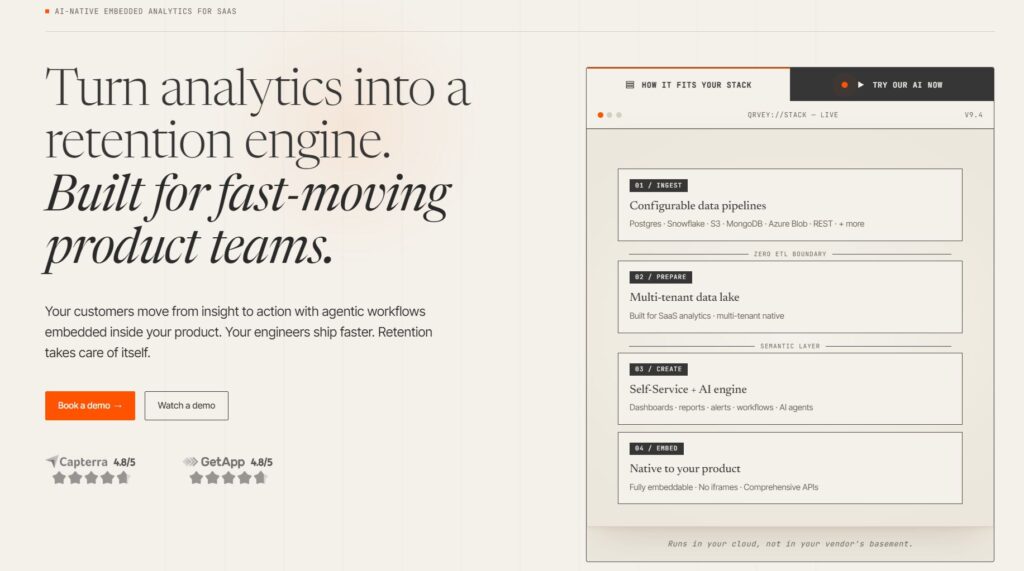
The top choice for embedded analytics for SaaS platforms. Qrvey lets you white-label beautiful dashboards directly inside your product. Your users get self-serve analytics without you having to build it from scratch. This is how you transform your SaaS into a true data product.
[White-label] [Multi-tenant] [Product differentiator]
Tableau Embedded / Power BI Embedded
Enterprise-grade embedded analytics for companies with complex data requirements and large budgets. High customization, strong governance, but expect a steeper implementation timeline. Best for mature SaaS products with dedicated data engineering teams.
[Enterprise-grade] [High customization]
Data Integration — Unify Fragmented Data, No ETL Pipelines Needed
Best for: Companies with data spread across CRMs, payment platforms, and product databases.
Peaka
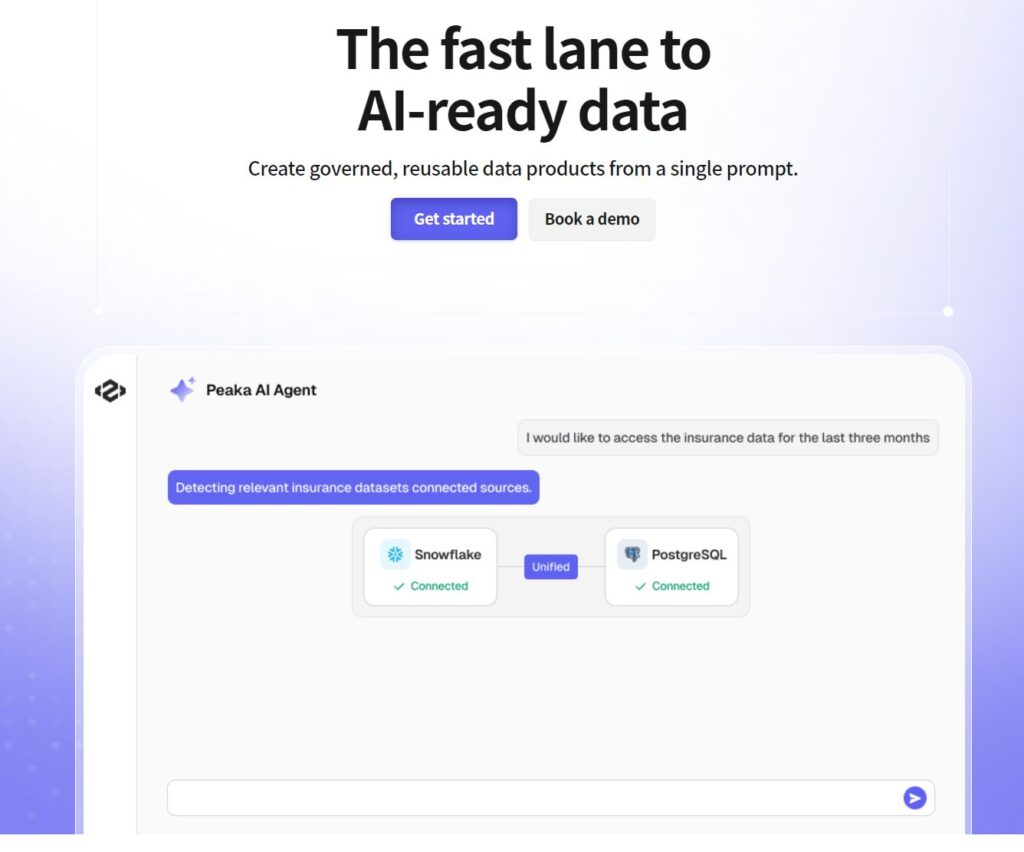
The best Zero-ETL data integration for SaaS teams. Peaka lets you query and join data from Stripe, HubSpot, PostgreSQL, and dozens of other sources in real time — no data pipeline, no warehouse, no engineering resources required. The ROI multiplies with every additional data source you connect.
[Real-time queries] [No-code setup] [Zero ETL]
Segment / RudderStack
The industry standard for customer data infrastructure. Segment collects every event across your product and routes it wherever you need it. It’s the data foundation layer — not an analytics tool itself, but essential before you layer analytics on top.
[Data infrastructure] [Event tracking]
5. Which Tools to Use at Each Growth Stage
The right tool stack depends on where you are — not where you want to be. Over-investing in tools too early burns budget and adds complexity. Here’s the smart progression.
| Growth Stage | Revenue Range | Recommended Stack | Priority |
| Early-Stage 0 → $10K MRR | Pre-PMF | Stripe Dashboard + GA4 (free) | Validate before investing in tools |
| Growth Stage $10K → $100K MRR | Scaling | Baremetrics + Cometly | Revenue clarity + ad attribution |
| Scale Stage $100K+ MRR | Expanding | ChartMogul + Qrvey + Peaka | Embedded analytics + data unification |
| Enterprise $1M+ ARR | Mature | Full stack + Segment + BI platform | Data governance + custom reporting |
Rule of thumb: Don’t add a tool until you feel the pain of not having it. The best analytics stack is the simplest one that answers your most important questions.
6. How to Actually Increase Revenue with Analytics
Installing tools isn’t a growth strategy. Using them to make specific decisions is. Here’s how high-performing SaaS teams turn analytics data into revenue.
Use Churn Analysis to Fix Onboarding
Segment churned users by their behavior in the first 14 days. If churned users never reach a key activation event, your onboarding is broken—not your product. Fix the onboarding flow, and you reduce churn without touching the core product.
Optimize Ad Spend Using LTV:CAC Data
Most teams optimize for conversion rate. Smart teams optimize for SaaS Customer Lifetime Value (LTV) data by acquisition channel. A channel with a lower conversion rate but higher LTV can be your best channel. Cometly makes this analysis straightforward.
Decompose MRR to Find True Growth Drivers
Your MRR is made up of four components: new MRR, expansion MRR, contraction MRR, and churned MRR. Baremetrics shows you all four. If expansion MRR is strong but new MRR is flat, double down on upsell — not acquisition.
Recover Revenue Automatically with Dunning
Failed payments silently cost SaaS companies 5–10% of revenue. Dunning management (built into Baremetrics) automatically retries failed charges, sends smart emails, and recovers MRR without any manual effort. Set it once — it runs forever.
7. Common Mistakes to Avoid
• Tracking revenue without tracking retention. Growing MRR while churn accelerates is a leaky bucket. Fix the leak first.
• Using too many disconnected tools. Five dashboards with five different data sources create confusion — not clarity. Consolidate.
• Ignoring marketing attribution. If you’re spending on ads and not tracking ROAS by channel, you’re guessing with real money.
• Skipping data infrastructure. Buying analytics tools before unifying your data sources is like building on sand.
• Measuring vanity metrics. Page views and signups mean nothing without activation, retention, and revenue correlation.
FAQ: SaaS Analytics Tools in 2026
What is the best SaaS analytics tool for startups in 2026?
For most early-stage startups, Baremetrics is the best place to start. It connects to Stripe in minutes, shows your MRR and ARR dashboard instantly, and includes dunning for revenue recovery. Once you start spending on ads, add Cometly for attribution. You don’t need more than that until you reach $100K in MRR.
What is a good LTV:CAC ratio for SaaS?
A healthy SaaS business targets an LTV:CAC ratio of 3:1 or higher. A ratio below 3:1 means you’re spending too much to acquire customers relative to what they’re worth. A ratio above 5:1 often means you’re underinvesting in growth. The 3:1 benchmark is widely used across the industry as the baseline for a viable business model.
How do I reduce SaaS churn rate effectively?
The most effective approach is to segment churn by user cohort and identify where users drop off in the lifecycle. Tools like Baremetrics help you track net and gross revenue churn. Then fix the root causes: weak onboarding, unclear value delivery, or poor feature adoption. Automated dunning handles the involuntary churn layer. Combining both can cut churn by 20–40%.
What is Zero-ETL and why does it matter for SaaS?
Zero-ETL means connecting and querying data from multiple sources directly — without building complex data pipelines or maintaining a separate data warehouse. For SaaS companies with data in Stripe, HubSpot, and their product database, Zero-ETL tools like Peaka allow real-time analytics without a dedicated data team. It’s faster, cheaper, and more flexible than traditional ETL.
What is embedded analytics, and does my SaaS need it?
Embedded analytics means building data dashboards directly inside your SaaS product for your users to access. If your customers make decisions based on data that your product generates, embedded analytics turns that data into a product feature — increasing stickiness, perceived value, and retention. Tools like Qrvey make this possible without having to build from scratch.
How do Stripe and Paddle reporting tools differ from general analytics platforms?
Stripe and Paddle reporting tools (like Baremetrics and Chartsy) are purpose-built for subscription revenue analysis. They understand concepts like MRR, ARR, churn, and dunning out of the box. General analytics platforms (like GA4 or Mixpanel) are built for behavioral tracking and require significant custom configuration to produce subscription-level financial metrics. For SaaS revenue reporting, dedicated tools save weeks of setup time.